|
In 2015, the Centers for Medicare and Medicaid Services (CMS) adopted SEP-1, a controversial sepsis quality metric drawn from the Surviving Sepsis Campaign (SSC) guidelines. Extensive focus on guideline evidence, covered well elsewhere, leaves out the details surrounding the process of its implementation. [1,2] This post will describe the process and address a misconception: contrary to what some say, adherence with the SSC guidelines does not affect CMS hospital payment. The Makings of a Quality Metric CMS collects data through the Hospital Inpatient Quality Reporting Program (IQR). [3] The Joint Commission and CMS collaborate on a common set of core quality improvement measures published in the Specifications Manual for National Hospital Inpatient Quality Measures (Specifications Manual). [4] For 2015, CMS added SEP-1, the “Early Management Bundle, Severe Sepsis/Septic Shock” to the Specifications Manual.5 SEP-1 originated from the SSC guidelines and was adopted based on National Quality Forum (NQF) recommendations (NQF #0500). [4] The NQF, a nonprofit created in 1999 by public and private sector leaders, makes recommendations about quality guidelines. Measures ratified by NQF through their consensus development process are considered by CMS for public reporting and payment programs. [6] Any person may submit a performance measure for NQF consideration. NQF forms a committee of individuals or organizations who must be nominated and approved. Each measure then undergoes committee review, NQF member and public commenting, and finally endorsement by the Consensus Standards Approval Committee (CSAC). After publication of an endorsed measure, any person can appeal within 30 days, subject to the review of an appeal board appointed by the NQF Board of Directors. Physicians comprise 59% of NQF committee chairs. Specialty societies have developed 30% of NQF-endorsed measures. As of July 2018, the CSAC includes 17 members of whom ten hold clinical degrees. What SEP-1 Does Do Hospital performance on SEP-1 does not directly impact CMS inpatient hospital payment or hospital accreditation, so far. [2,7] CMS has the authority, granted by law, to adjust payment rates for successful submission of data through the IQR Program - the results of the data notwithstanding.8 While CMS does track certain metrics for payment, SEP-1 is not currently included in these programs. The Specifications Manual lists SEP-1 as a “CMS only” metric, meaning the Joint Commission does not use SEP-1 data in its accreditation process.[4,9] Although CMS does not require adherence to SEP-1, there are many reasons for hospitals to pay attention. CMS has the authority to reduce payments for not submitting SEP-1 data (and other data included in the IQR) and the option to convert SEP-1 to a pay-for-performance metric. Here in New York State, the Department of Health has required hospitals to develop sepsis protocols and report performance data since 2014. [10] In July, CMS began publicly reporting sepsis performance data on Hospital Compare. [11] Additionally, endorsement of metrics by CMS might justify their use by other institutions that provide hospital funding. The frenzy over CMS’ implementation of the SSC guidelines via SEP-1 demonstrates the power of their edicts. The mere collection of data has motivated resource shifting in emergency departments and hospitals nationwide. [12] Implications for Advocacy For physician advocates, the process that created SEP-1 is equally relevant as the evidence underpinning it. Influential bureaucratic institutions including CMS and the Joint Commission listen to organizations like the NQF. Physicians need an accurate understanding of a policy, i.e. data submission versus payment metric, in order for intelligent advocacy. As much as we debate the clinical evidence in academic journals, we have to bring those opinions to the institutions that drive guideline creation, endorsement, and payment. First posted on The Original Kings of County References
0 Comments
How much do hospitals spend just to get paid? A new study [1] in JAMA estimates that the cost of billing and insurance activities at a large academic health system in Durham, North Carolina ranged from $20 for a primary care visit to $62 for an emergency visit to $215 for an inpatient surgical procedure. This corresponds to 3-25% of total professional revenue collected (excluding facility fees). Altogether, health system staff spend 13 to 100 minutes processing each bill. 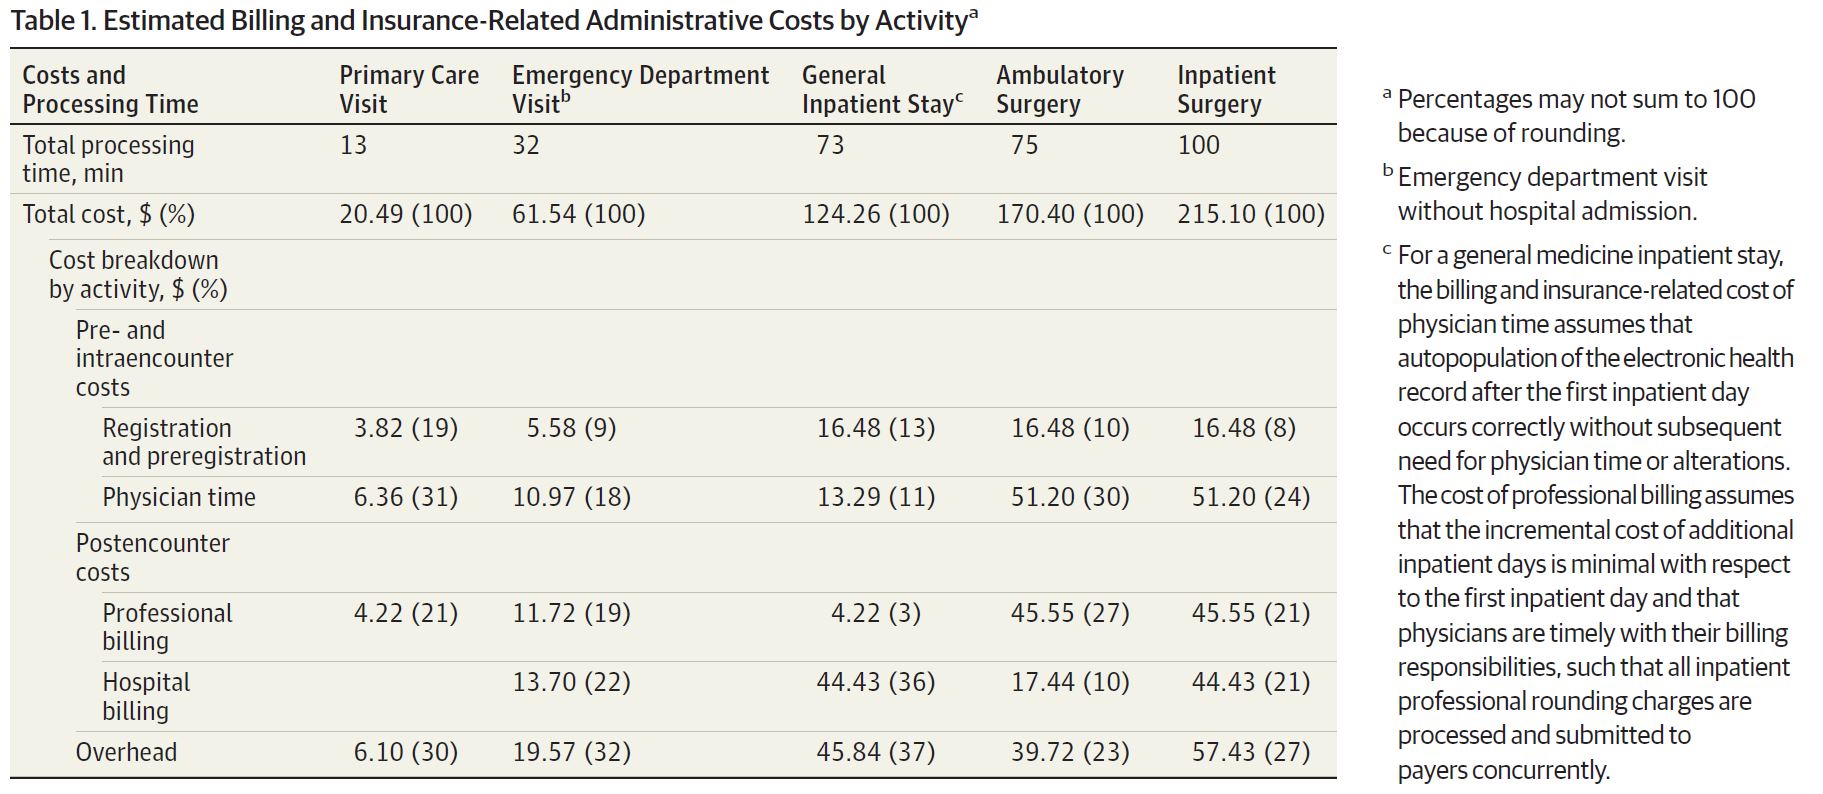 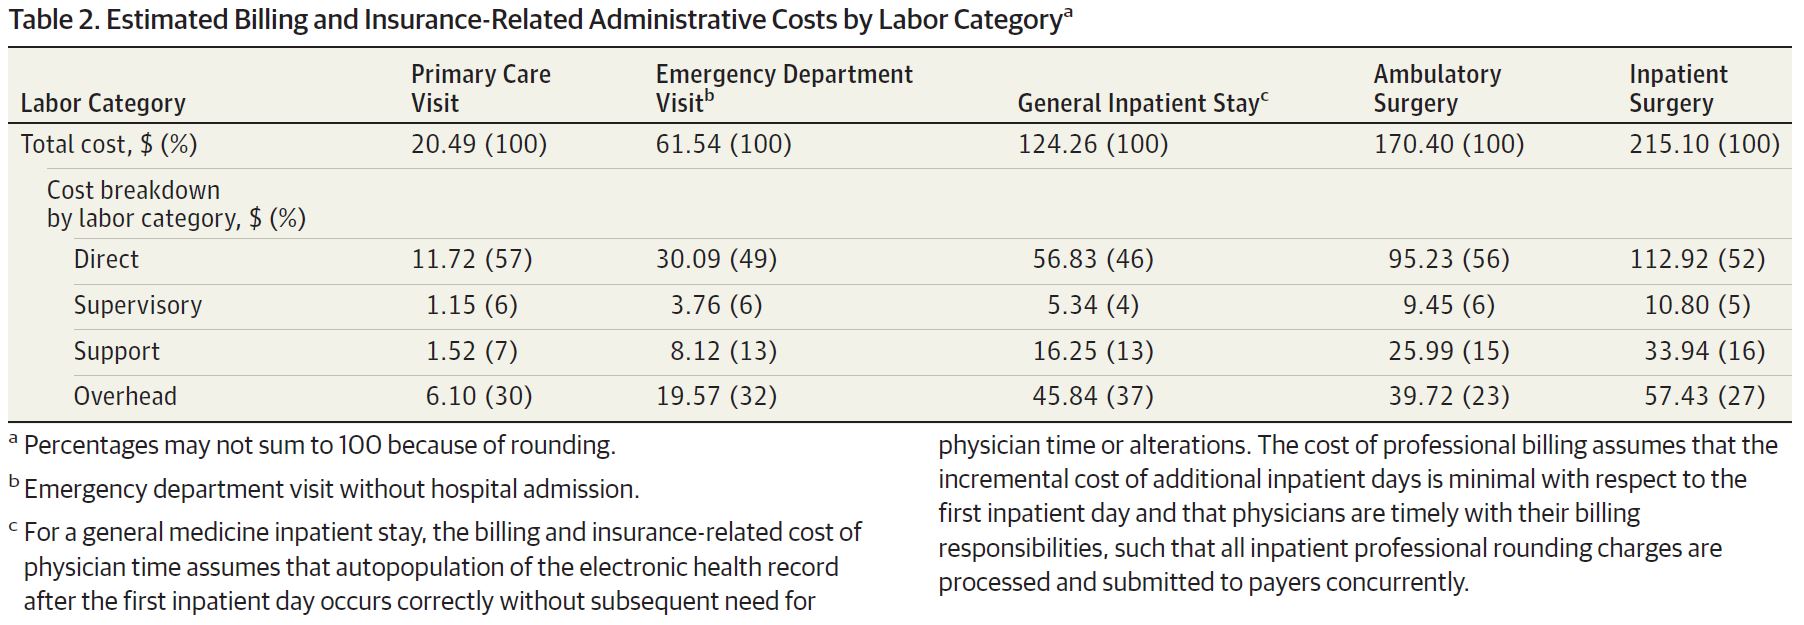 Tseng et al. (2018) The authors used a state-of-the-art accounting method known as time-driven, activity-based-costing. This method involves mapping out who touches a bill at each stage of its life and the cost in time and dollars of each person’s labor: including the registration desk verifying the patient’s insurance information, the physician entering ICD-10 codes, and the cash manager accepting the payment. 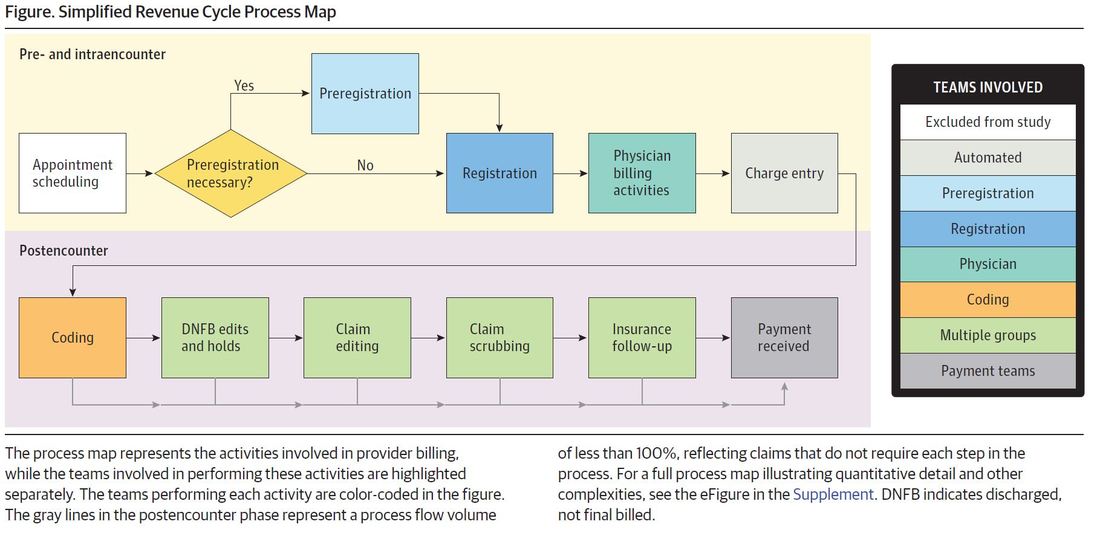 Tseng et al. (2018) I spoke to lead author Phil Tseng who is also an incoming EM resident at Ohio State (congrats Phil!). Tseng says he was most surprised by the size of the behind-the-scenes billing operation and the fact that 70 to 90% of the billing cost came from non-physician labor. The billing machine consists of >1500 employees housed at a large complex 10 miles off campus. Interestingly, when when they refer to “the back end” of the electronic medical record, it is in reference the clinical side.
Much of this billing cost, Tseng notes, comes from lack of standardization. The authors actually found that the “billing process did not reveal any significantly wasteful or inefficient efforts,” but as Tseng notes, it’s a well-oiled machine working in a broken system. Billers have to deal with thousands or more health care plans with different inclusions or exclusions - some cover physical therapy but not mental health, some cover 1 or 2 of a particular service per year, certain employers might have special packages, etc. Tseng et al. [1]conclude the paper saying knowledge about billing and administrative costs such as those elucidated in the study may help inform policy solutions to reduce administrative expenses. Other studies have also quantified the uniquely high proportional cost of administration in US healthcare as compared to other industries and other countries, highlighting this as as an expense-reduction target. [2-8] However, that may be a hard sell for the 1500 employees at Duke billing who could could lose their jobs. We all want the most efficient administrative system for patients. The question remains how to make that transition when one person’s administrative waste and expense is another person’s income and livelihood. First posted on The Original Kings of County. References 1. Tseng P, Kaplan RS, Richman BD, Shah MA, Schulman KA. Administrative Costs Associated With Physician Billing and Insurance-Related Activities at an Academic Health Care System. JAMA 2018;319(7):691–7. 2. Collins SR, Nuzum R, Rustgi SD, Mika S, Schoen C, Davis K. How health care reform can lower the costs of insurance administration. Issue Brief 2009;61:1–19. 3. Jiwani A, Himmelstein D, Woolhandler S, Kahn JG. Billing and insurance-related administrative costs in United States’ health care: synthesis of micro-costing evidence. BMC Health Serv Res 2014;14:556. 4. Morra D, Nicholson S, Levinson W, Gans DN, Hammons T, Casalino LP. US Physician Practices Versus Canadians: Spending Nearly Four Times As Much Money Interacting With Payers. Health Aff 2011;30(8):1443–50. 5. Riley GF. Administrative and claims records as sources of health care cost data. Med Care 2009;47(7 Suppl 1):S51–5. 6. Sakowski JA, Kahn JG, Kronick RG, Newman JM, Luft HS. Peering into the black box: billing and insurance activities in a medical group. Health Aff 2009;28(4):w544–54. 7. Papanicolas I, Woskie LR, Jha AK. Health Care Spending in the United States and Other High-Income Countries. JAMA 2018;319(10):1024–39. 8. Lee VS, Blanchfield BB. Disentangling Health Care Billing. JAMA 2018;319(7):661. US health care spending has had a notorious reputation for high spending and low outcomes. [1] A new study in November’s JAMA tackles from a high level perspective the question of why the US is such an outlier with its high health care spending. Dieleman et al (2017) [2] identified the most prominent cost drivers from 1996-2013 across type of care (ambulatory, inpatient, pharmaceuticals, nursing facility, emergency), demographic trends (growth, aging), disease prevalence, service utilization, and service price and intensity. Service price and intensity accounted for more than half of the nearly $1 trillion increase in US health care spending, according to their study (red dot, top figure). [2] Among the different care locations, emergency and dental care spending increases were almost entirely driven by price and intensity (last two rows, bottom figure). [2] 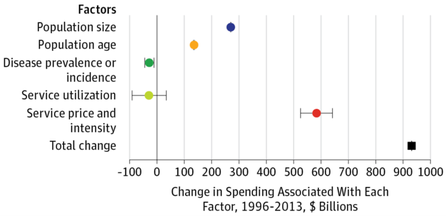 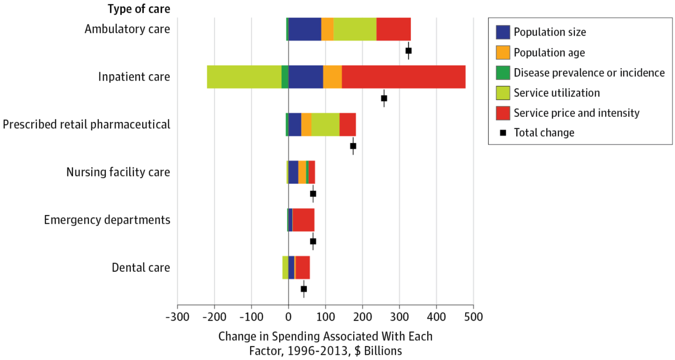 Given limitations of the data, the authors could only separate some measures of service. Service utilization (e.g. number of visits) is measured separately from price (cost per visit). However, the data could not separate price from service intensity - the amount or level of service (e.g. E/M code level) rendered in a particular transaction. For example, if the price of an inpatient hospitalization increases to $2,000 from $1,000, the data cannot differentiate whether the price went up because the same services were twice as expensive (price) or more tests were ordered (intensity), or a combination of the two. While patients may be getting more per service, many studies demonstrate that the same care in the US is simply more expensive. [3,4]
Knowing where the spending is growing may provide objective guidance on where to go from here. The fact that service price and intensity drives over half of the spending makes other often-cited spending drivers secondary. Such drivers may include more hospitalizations or doctor visits, population aging, medical technology, high levels of comorbidity, and lack of primary care. All of these things matter, but focusing on those areas may not be where we are going to get the most bang for our buck. Controlling growth of price and intensity requires thinking about system-level factors. Consider, for example:
This study [2] points to which types of policies can have the most impact on spending increases. We should recognize that if policy makers are looking towards the role of service price and intensity, that is where physicians need to actively engage in as well. Rising prices can seem distant from our daily clinical work, but if we do not spend time shaping the policies that dictate prices, other people will. If we do not responsibly self-regulate the intensity of our work-ups, other people will. Originally posted on The Original Kings of County. References
Avoidable Emergency Department (ED) visits are difficult to define but of vital interest to ED reimbursement and profit. A newly released study [1] from UCSF Department of Emergency Medicine estimated “avoidable” visits comprise 3.3% of ED visits. Some have hailed the study as evidence that avoidable ED visits are a “myth,” claiming there is no basis to challenge ED visit reimbursements for these visits. [2] In reality, we should take a more nuanced view of this conclusion.
Calculating the proportion of avoidable ED visits is subjective, and no single study estimate can capture the complexity of defining and measuring avoidability. Past research illuminates the subjectivity with prior estimates ranging from 5 to 90% depending on methodology, for example hospital admissions or triage scores. [3] The UCSF study chose an intentionally restrictive definition of avoidable visits as any visit “not requiring any diagnostic tests, procedures, or medications.” For example, this definition does not capture a patient who had a simple sore throat, was given ibuprofen for pain, and then discharged with instructions to see their primary doctor. The debate about the exact proportion of avoidable visits distracts us from a more important question: whether patients are receiving the best quality care at the lowest cost, both to the system and the patient. Where should that sore throat really go to get the “right thing, at the right time, in the right way, for the right person”? [4] The “right way” for a patient with a simple sore throat is a lower acuity setting like the primary doctor or an urgent care where they could likely get seen faster, more cost effectively, and without competition with sicker patients. Avoidable ED visits exist. Instead of trying to decide if the proportion of avoidable visits is large enough to be an issue, let us focus on identifying the “right way” for each patient. First posted on The Original Kings of County. References 1. Hsia RY, Niedzwiecki M. Avoidable emergency department visits: a starting point. Int J Qual Health Care 2017;1–4. 2. Minemyer P. Only 3% of emergency room visits may truly be avoidable, study suggests [Internet]. Fierce Healthcare. 2017 [cited 2017 Sep 29];Available from: http://www.fiercehealthcare.com/healthcare/just-3-er-visits-may-truly-be-avoidable-study-suggests 3. Durand AC E al. ED patients: how nonurgent are they? Systematic review of the emergency medicine literature. - PubMed - NCBI [Internet]. [cited 2017 Sep 29];Available from: https://www.ncbi.nlm.nih.gov/pubmed/20825838 4. Your Guide to Choosing Quality Health Care: A Quick Look at Quality [Internet]. [cited 2017 Sep 29];Available from: https://archive.ahrq.gov/consumer/qnt/qntqlook.htm At a recent panel on the movement to value in health care, the panelists were asked to reflect on what metrics to measure success in value-based care, and someone suggested mortality as a long-term outcome. The Chief of Medicine countered in disagreement, "If you wanted to improve mortality, you wouldn't invest in health care. You would invest in the economy, eradication of poverty, education, high school graduation rates." The Chief proposed that the goal our health care system should be to reduce the burden of health on its people. These ideas reflect several truths about medicine: most of what we do lacks clear evidence of benefit especially in terms of mortality; mortality may or may not be the most important or measurable outcome; and social determinants can be more prominent than organic processes in determining health.
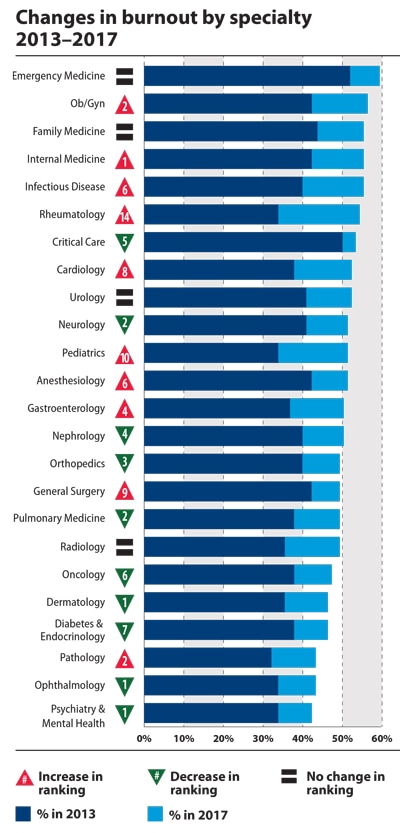
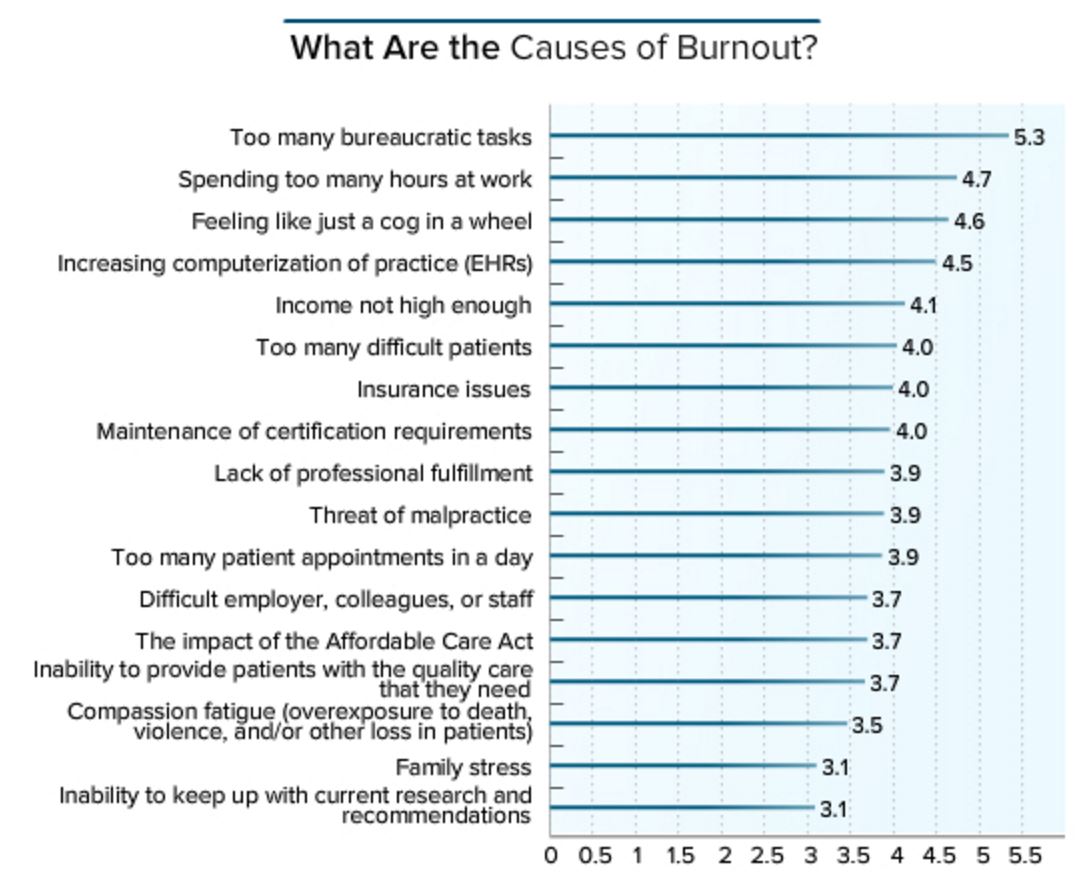
A Medscape 2017 Survey of <14,000 physicians reveals that:
  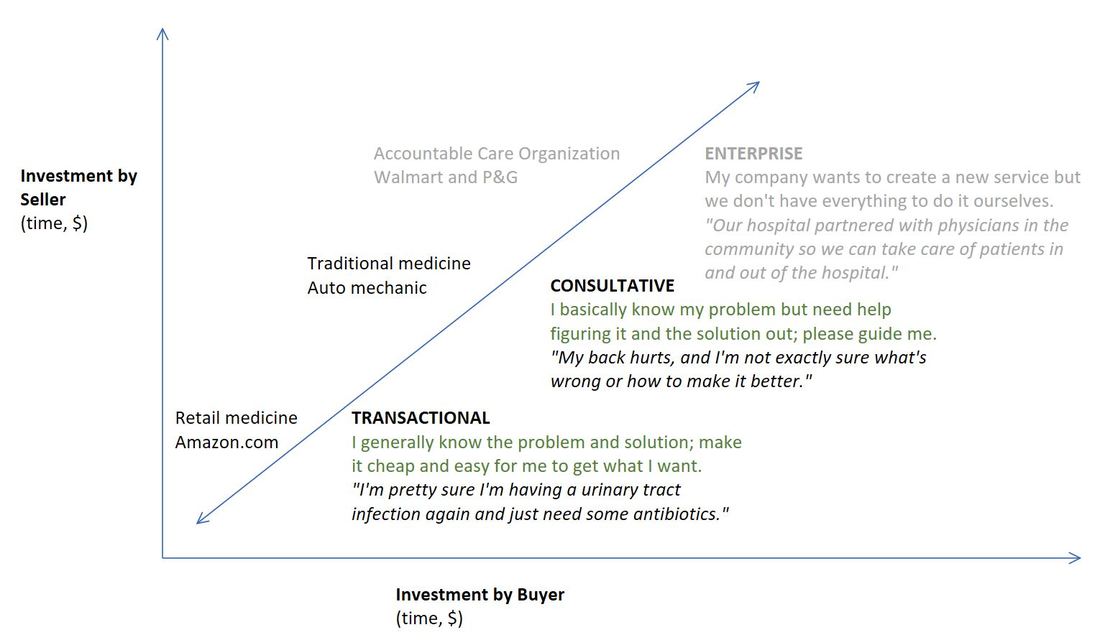 The sales concept of transactional vs. consultative selling is a useful framework to make physicians rethink their negative attitude towards retail medicine (e.g. CVS Minute Clinic) into something more productive or even positive. The graph below defines these categories of selling and buying that provide useful insights into what the buyer (i.e. patient) expects and how the seller (i.e. health care provider) can successfully meet those needs. (The Enterprise category is included for completeness but not relevant to this post).
The importance of recognizing whether a buyer wants a transactional or consultative relationship is that it is annoying and ineffective to provide the wrong type. I might choose to go to Amazon.com to buy a black BIC pen because I know what I want and I want it with the least hassle (cheap price, low fees). If Amazon tried push a consultation with me about what kind of pen I need, I would be annoyed and look elsewhere. Patients are increasingly viewing components of their health care as transactional and are often not wrong to expect it. They want cheap, convenient ways to solve well-defined problems whether it’s a flu shot or an uncomplicated urinary tract infection. Retail medicine is doing a better job of meeting these needs than the average traditional primary care practice. Physicians have reacted to the growing demand for retail medicine by trying to assert their unique value as health care providers - highlighting their greater ability to deal with complicated problems, build a relationship with the patient, and provide continuity of care. Essentially, they are trying to sell consultatively when the buyer is just looking for a transaction. This is an ineffective angle to redirect patients from retail clinics to traditional clinics. Patient safety and continuity of care is a legitimate concern but these are questions of defining the scope of retail medicine (which illnesses can be appropriately transactional) and facilitating maximal referrals to primary care. Physicians should engage in retail clinics’ successful and safe execution rather than try to fight turf wars and broadly discredit the health care providers staffing retail clinics. To stay relevant and valuable to patients who are demanding a new paradigm of transactional care, physicians have to start from the needs of the patient. Reference DeVincentis J, Rackham N. Rethinking the Sales Force: Redefining Selling to Create and Capture Customer Value. McGraw Hill Professional; 1999. |
Archives
September 2018
Categories |
 RSS Feed
